Growing companies often struggle with managing their inventory in the following ways:
- The production line is down because it’s out of one component
- Someone thought they could save money by buying in bulk, and now it takes up way too much space
- The company is short on liquid assets yet sitting on excess raw materials for production
- A great problem to have, but sales have outpaced the company’s ability to keep inventory on order
Much has been written in the last few decades about efficiently managing inventory. The American automotive industry has optimized its supply chain so that parts are sent to the production line exactly when needed, even going so far as to set up suppliers across the street from their factories. This isn’t realistic for most companies, but inventory management can be applied to small companies or even one’s pantry.
One of the tasks Zebulon Solutions helps companies manage is their raw material, to ensure they have enough materials to meet their customers’ demand yet don’t have too much money tied up in materials. This is frequently accomplished through a visual management system. My own pantry has benefited from setting up such a system to limit over-buying one item, say boxes of chicken stock, while running out of diced tomatoes.
I didn’t invent this system. The original concept was developed in the 1940s by an industrial engineer and businessman in Japan working for Toyota, Mr. Taiichi Ohno. He invented a simple planning system to optimally manage work and inventory at every stage throughout production, which became known as “Kanban.” Over the years, this has evolved into production lines using bins for visual management, process mapping, and taken into the software development world by David Anderson[1]. As for my pantry, I mostly use a visual management system for my raw material with predetermined reorder points, reorder quantities, known lead times, and estimated usage. Using a raw material example from my pantry, cans of diced tomatoes, we can understand how this could be translated to a production environment.
Visual planning or visual management – a means of quickly looking at something to determine what is missing, out of place, or needs to move. In my pantry, I can easily get a visual snapshot of what needs to be purchased and help me not overbuy when there is a good sale, or global pandemic, going on.
 Raw material – in this example, it’s the diced tomatoes. In industry, it could be anything from bolts to circuit boards, plastic resin to fans. Whatever that factory is using to fabricate or assemble their products. Since diced tomatoes come in multiple sizes and my usage is inconsistent throughout the year (making soups in the winter), it will help us look at how this can be applied in a manufacturing setting. A visual planning system doesn’t require consistent usage.
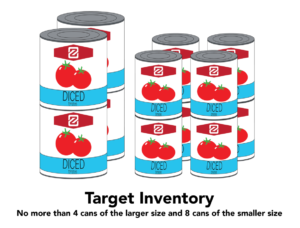
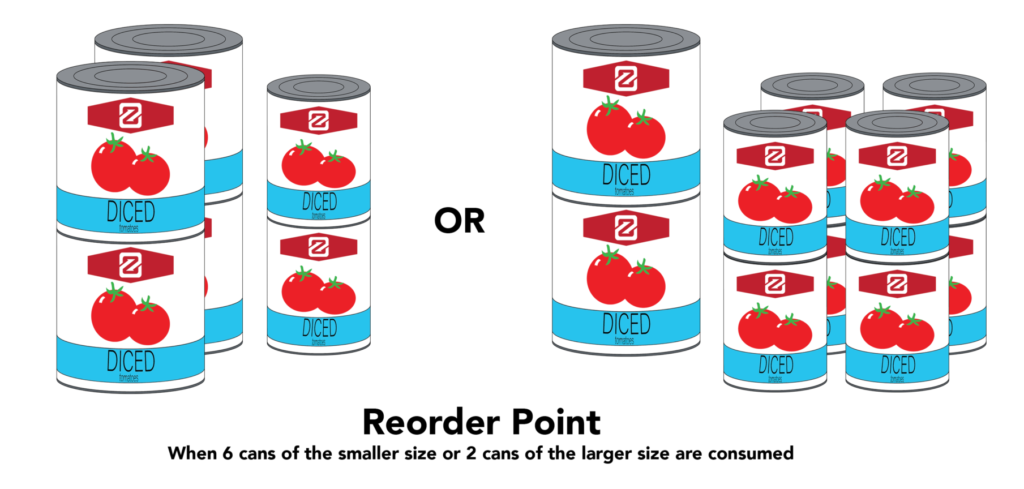
 Reorder point – the point of consumption where the raw material needs to be replenished. This triggers the buyer to order more based upon lead time. Typically, this isn’t set to zero, because that would cause the production line (or my recipes) to come to a halt while the raw material is ordered and shipped. Since tomatoes can be purchased in multiple sizes, the target inventory is to have no more than 4 large cans (28oz) and 8 small cans (14.5oz). This is slightly more than what is consumed in a week, but it also allows for the fluctuation in usage without incurring an additional trip to the grocery store (or an expedite fee in industry). When 6 small cans or 2 large cans are consumed, diced tomatoes are added to the shopping list.
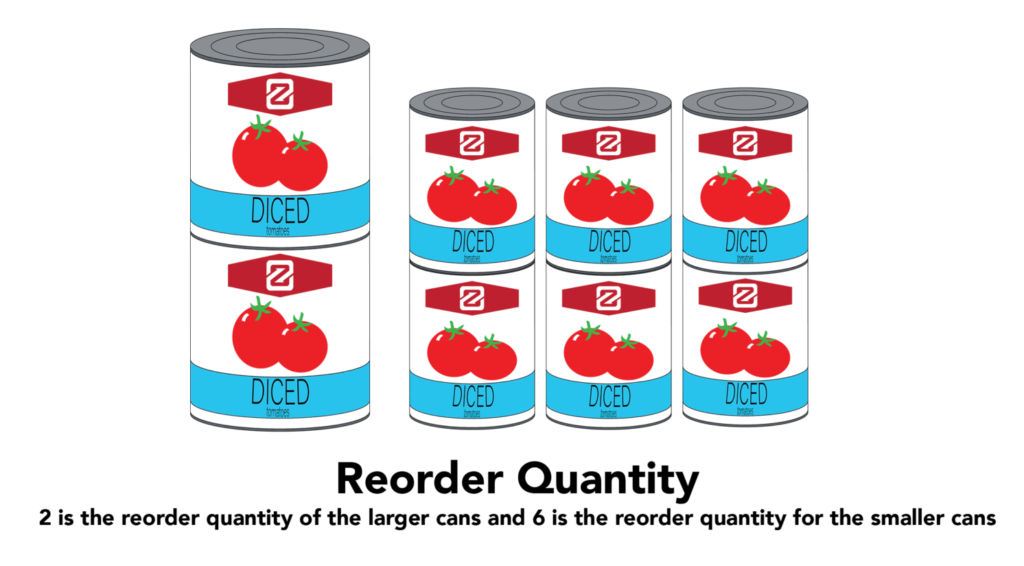
 Reorder quantity – the amount of raw material that is purchased when the reorder point is triggered. In the example of diced tomatoes, “6” is the reorder quantity of the smaller cans and “2” is the reorder quantity for the larger cans. In industry, the person who notices the Reorder Point is rarely the same person who places the order for the raw material. The person placing the order would look up the Reorder Quantity for each raw material and place the order with the supplier.
Lead time – the time between when a raw material is put on order and when it ships. Using the example of diced tomatoes, I grocery shop once every 7-10 days. The reorder point is established based upon how many cans would be consumed in a worst-case scenario, 10 days. If a recipe emergency occurred (oops, Auntie is coming over for dinner, what now?) and the demand for diced tomatoes suddenly increased (making the tomato-based soup she loves), I could process an expedited order and make an unplanned trip to the grocery store. In industry, a phone call to the raw material supplier could shorten lead time and sometimes a fee is levied on the unit price for the expedited delivery.
A second consideration is lead time increase. Especially relevant recently, where certain items have become suddenly unavailable, at the grocery store. What happens when the lead time increases from 10 days to 14 or even 140? This type of increase in lead time is not uncommon in industry where capacitors, for example, increase from being readily available to 52 or 86 weeks of lead time due to a major cellphone manufacturer placing ‘intent to purchase’ orders in the supply chain. For my tomatoes, it would be prudent to increase the reorder point (buy cans earlier) or the reorder quantity (buy more cans) or perhaps both if there is a substantial disruption to the supply chain, like we’ve seen recently.
While I’ve used tomatoes in my example, Kanban can apply to any inventoried item, whether in industry or a household, that is regularly consumed and purchased. A visual management system will help you keep a cool head when rumors of material shortages or unavailability occur. If you buy based on your actual usage, lead time, and reorder points, you should be able to prevent running out of items while maximizing your liquid assets….and your trips to the grocery store might be a little less chaotic.